Aggregations
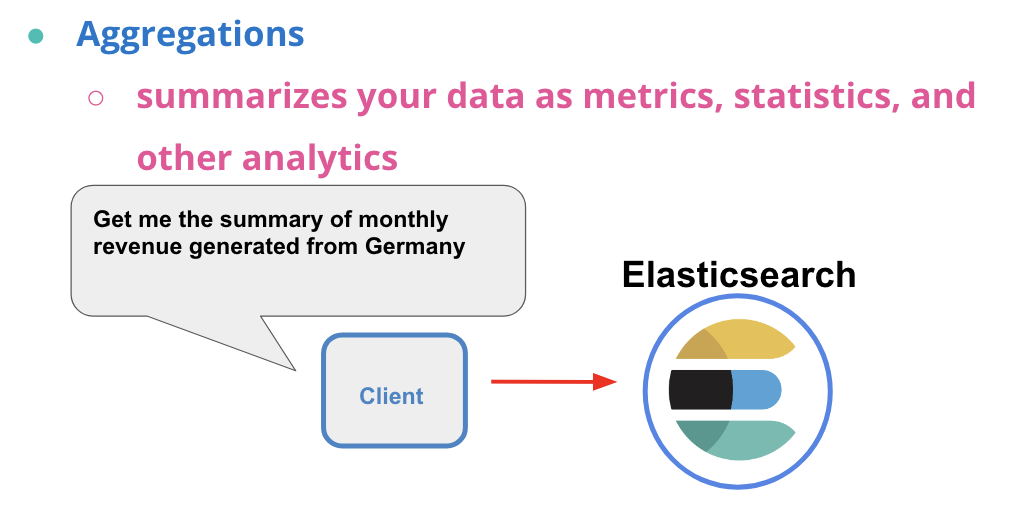
Aggregations은 검색 결과에 대한 집계 데이터를 생성하는 기능이다. 검색 결과를 좀 더 쉽게 요약해서 보고 싶을 때 사용할 수 있다. Aggregations를 사용하여 총 수익, 월별 수익 등 다양한 집계 데이터를 생성할 수 있다. 이를 통해 엘라스틱에서 더 효율적인 검색결과 분석이 가능하다.
- Query가 원하는 검색에 대한 문서 정보를 반환하는 목적이라면,

- Aggregations은 원하는 검색에 대한 문서들의 요약을 반환한다.

Metric Aggregations
Metric Aggregations은 검색 결과에 대한 숫자 데이터 집계를 수행하는 기능이다. 이 기능은 수치 데이터의 요약정보를 쉽게 이해할 수 있도록 해준다. 예를 들어, sum, min, max, avg, unique count(cardinality) 등이 있다. 기본적으로 요약정보는 aggregation 서머리와 함께 top 10 hits 문서들을 반환한다.
GET ecommerce_data/_search
{
  "size": 0,
  "aggs": {
    "sum_unit_price": {
      "sum": {
        "field": "UnitPrice"
      }
    }
  }
}
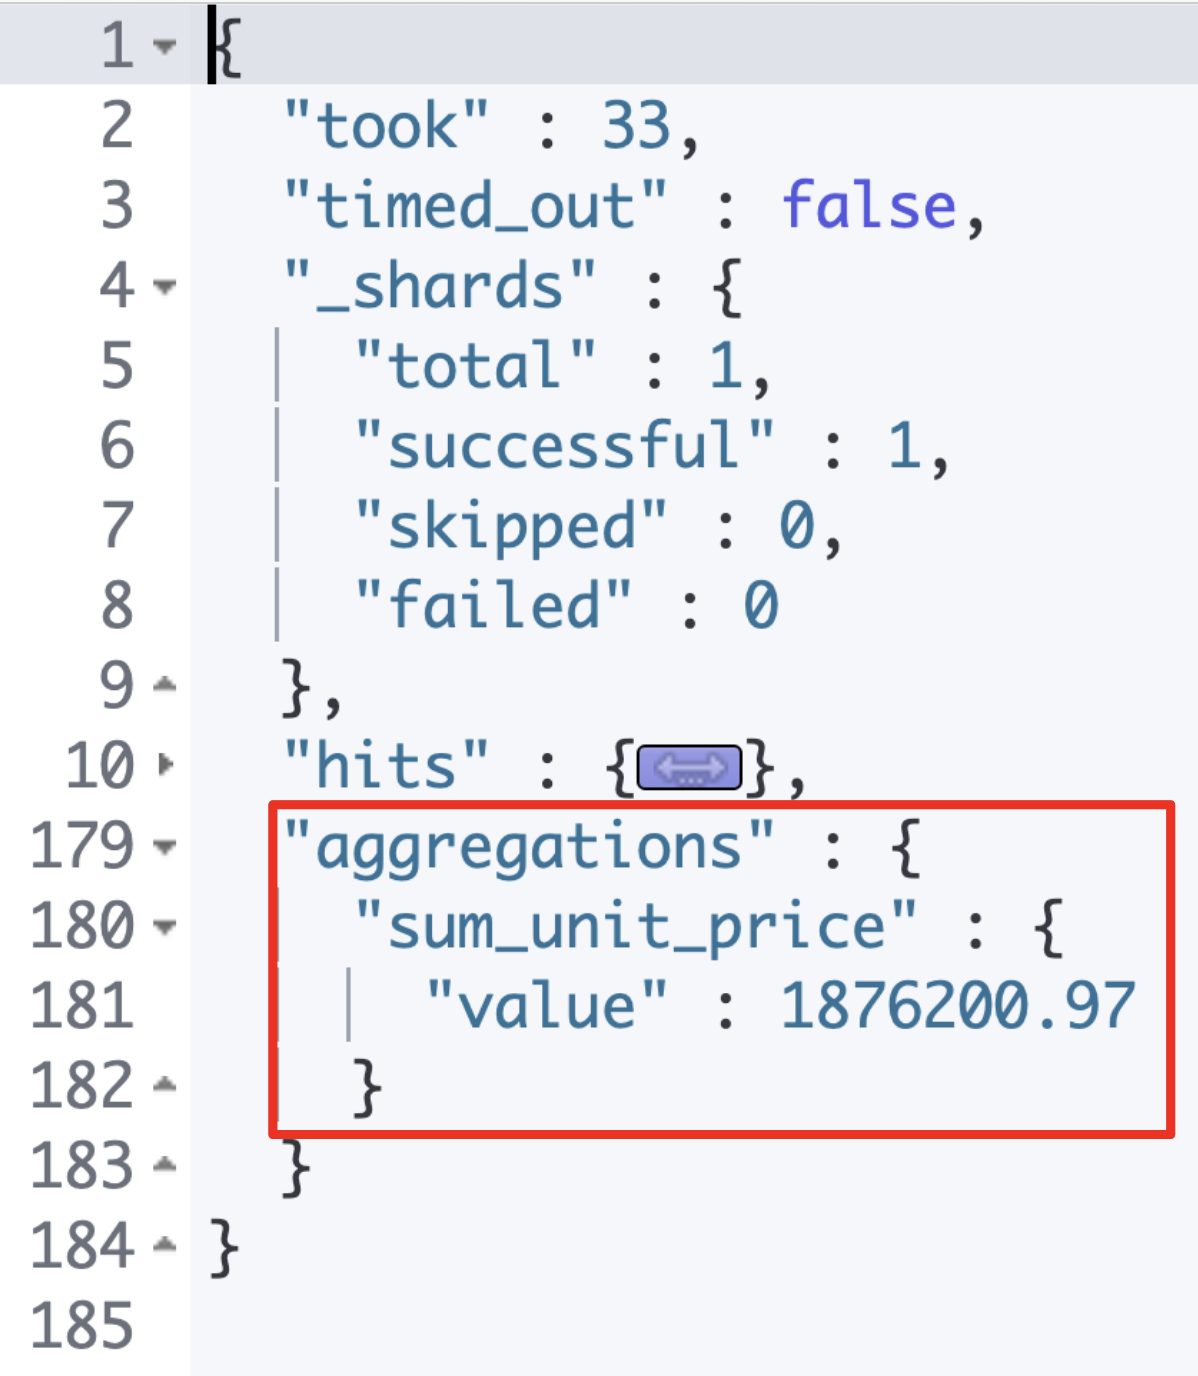
- 위 Aggregation은 단위 가격 필드에 대한 요약 정보 총합을 계산한다.

- "aggregations" 필드에 단위 가격에 대한 총합 요약값을 확인할 수 있다.
- 쿼리의 'size: 0'로 Aggregations에서 반환되는 top 10 결과를 생략가능하다.
Stats Aggregation
이러한 sum, min, max, avg, unique count(cardinality) 메트릭 계산을 하나하나 입력할 수도 있지만, Stats Aggregation을 사용하면 한번에 요약정보를 확인가능하다.
GET ecommerce_data/_search
{
  "size": 0,
  "aggs": {
    "all_stats_unit_price": {
      "stats": {
        "field": "UnitPrice"
      }
    }
  }
}
- 위 Aggregation에서는 sum 대신 stats가 요청값에 들어갔다.

- stats agg 사용시 위의 명령들을 한번에 확인할 수 있다.
Bucket Aggregations
Bucket Aggregations은 대상을 버킷으로 그룹핑하여 집계를 수행하는 기능이다. 이를 사용하여 월별 수익, 가격 구간별 판매량 등 다양한 집계 데이터를 생성할 수 있다. 버켓으로 그룹핑된 데이터를 통해 좀 더 효율적으로 검색 결과를 분석할 수 있다.

Date Histogram Aggregation
Date Histogram Aggregation은 날짜 기준으로 데이터를 분할하여 보여주는 Aggregation이다. 날짜 기준으로 데이터를 보고 싶을 때 사용한다. Fixed interval과 Calendar interval 두 가지 기준으로 인터벌을 나눌 수 있다.
1. Fixed interval
GET ecommerce_data/_search
{
  "size": 0,
  "aggs": {
    "transactions_by_8_hrs": {
      "date_histogram": {
        "field": "InvoiceDate",
        "fixed_interval": "8h"
      }
    }
  }
}
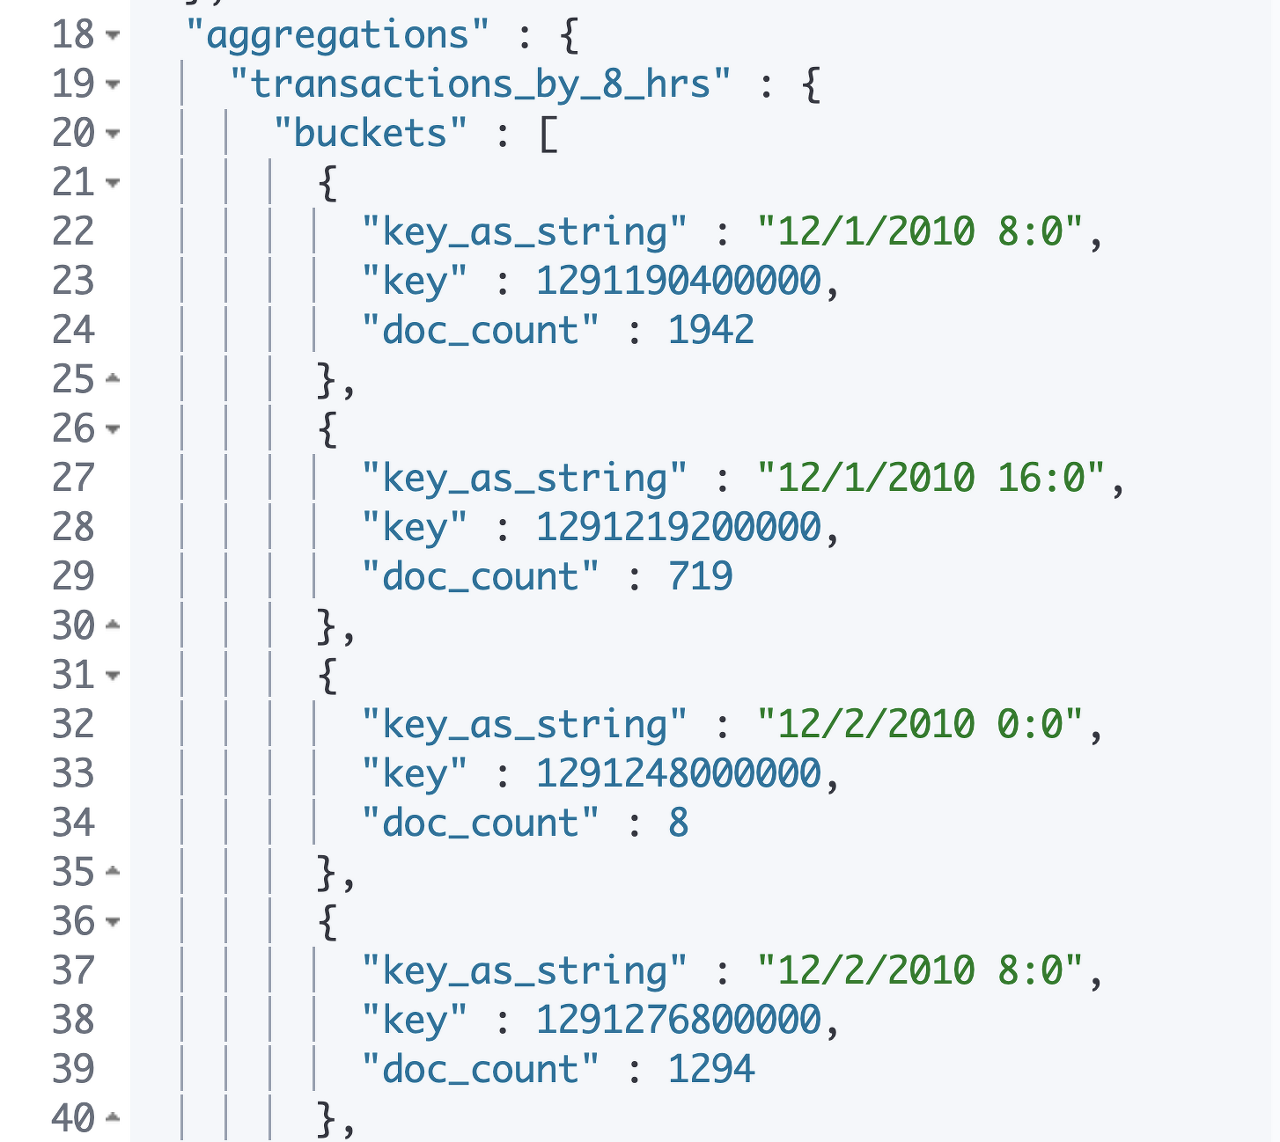
- 8시간 주기의 Fixed interval을 생성하여 데이터를 분할하여 버켓에 나누어 볼 수 있다.

2. Calendar interval
GET ecommerce_data/_search
{
  "size": 0,
  "aggs": {
    "transactions_by_month": {
      "date_histogram": {
        "field": "InvoiceDate",
        "calendar_interval": "1M"
      }
    }
  }
}
- 1달 주기의 Calendar interval을 생성하여 데이터를 분할하여 버켓에 나누어 볼 수 있다.

Histogram Aggregation
Histogram Aggregation은 Numeric 데이터 기준으로 그룹핑하여 집계를 수행하는 Aggregation이다. Numeric 데이터 기준으로 그룹핑하고 집계할 수 있다.
GET ecommerce_data/_search
{
  "size": 0,
  "aggs": {
    "transactions_per_price_interval": {
      "histogram": {
        "field": "UnitPrice",
        "interval": 10
      }
    }
  }
}
- 단위가격 구간 10 기준으로 버켓을 나누는 예제

Combined Aggregations
마지막으로 Combined Aggregations은 여러 개의 집계를 하나의 요청에서 함께 사용하여 데이터를 복잡하게 분석하는 것이다. 이를 통해 데이터를 더 자세하게 분석할 수 있다. 예를 들어, Date Histogram Aggregation과 Range Aggregation을 결합하여 월별 판매 데이터와 가격 범위별 판매 데이터를 분석할 수 있다.
GET ecommerce_data/_search
{
  "size": 0,
  "aggs": {
    "transactions_per_day": {
      "date_histogram": {
        "field": "InvoiceDate",
        "calendar_interval": "day"
      },
      "aggs": {
        "daily_revenue": {
          "sum": {
            "script": {
              "source": "doc['UnitPrice'].value * doc['Quantity'].value"
            }
          }
        }
      }
    }
  }
}
- 월별 수익 데이터로 총 수익을 계산해야 하는 상황을 가정,
- script를 사용하여 없는 필드를 계산할 수 있다.


